On Friday, March 8th, we organized a Verrijkt Koninkrijk Linked Data Hackathon at the Intertain Lab of VU Amsterdam. The event was co-sponsored by the Network Institute. The goal of the hackathon was to allow third party developers to produce (ideas for) innovative applications beyond the Verrijkt Koninkrijk core research questions. We especially encouraged the use of the Linked Data produced in the project.

As organizers, we are very happy with the produced prototypes. The benefits are following:
- The produced applications show the (unexpected) reusability of the VK (Linked) Open Data. The applications produced or suggested give new browsing opportunities, links to other datasets or show how the data can be used in a completely novel context.The hackathon revealed that indeed the data is usable for external developers using the documentation provided. Some bugs were found, some of which could be fixed during the hackathon.
- Important concepts around data quality were articulated by the users. Although it falls outside of the scope of this project, subsequent curation of the dat should involve considering ways of allowing experts or amateurs to correct errors in the data.
- The VK project data is made known to researchers and developers from related projects, for example that of Agora or BiographyNed. We expect that this ensures future use of the data by related projects.
We here present short descriptions of what the six hacker teams cooked up. Two prize winners were announced by the jury, for “best use of data” and “coolest app” respectively. The jury consisted of Kees Ribbens and Edwin Klijn from NIOD, Serge ter Braake and Victor de Boer from VU. More photos of the event can be seen at www.few.vu.nl/~vbr240/verrijktkoninkrijk/hackathon/.
TOUR APPLICATION AND TOUCH TABLE DEMO [Niels Ockeloen] WINNER “COOLEST APP”

Niels used the data from the Named Entity index to create a history browser which allows the user to browse information about WWII on basis of persons, locations, organisations, etc. (the NER classes). For this he reused the Agora Touch demonstrator. When a class is chosen a list of entities is shown with images which are resolved through the alignment with DBpedia. Niels used the LDtogo framework to map the selected data on the API interface of the Agora demo.
VERRIJKT KONINKRIJK ON FACEBOOK [Albert Merono & Wouter Beek] WINNER “BEST USE OF DATA”
This group set out to to recreate the network of important people of the Netherlands during WWII and their quotes in fake Facebook profiles, trying to imitate the reality of their time. We feed automatically these streams with the contents of the VK datasets: little Cliopatria and Python snippets retrieve data from SPARQL endpoints, resolve the structured XML texts, extract the quotes and expose them using the Facebook Graph API. View the project on GitHub and see the live demo at http://www.facebook.com/verrijkt.koninkrijk
INTEGRATION WITH AGORA RIJKSMUSEUM DATA [Lourens van der Meij]
 Lourens aligned the VK data with that of Agora Rijksmuseumusing the Amalgame alignment tool. This is used to link VK data to RM images using the Rijksmuseum API via http://eculture2.cs.vu.nl:43020/ (results shown here (pdf)) He furthermore started to use the Verrijkt Koninkrijk data to add links to VK from within our AGORA demo that is an event centered browser for the Rijksmuseum content. Very rough results show a AGORA demo entry for Duitsland.
CUBE-BASED BROWSING [Chris van Aart]
 The application of Chris van Aart shows how the monument data from Vier en Vijf Mei can be browsed using the Cube browser on IOS. THis allows for multi-faceted browsing between Dutch war monuments. By flipping the screen, one can actually look at the RDF data!
MAP LAYERS SHOWING THE LIBERATION OF NIJMEGEN [Michiel van Dijk]
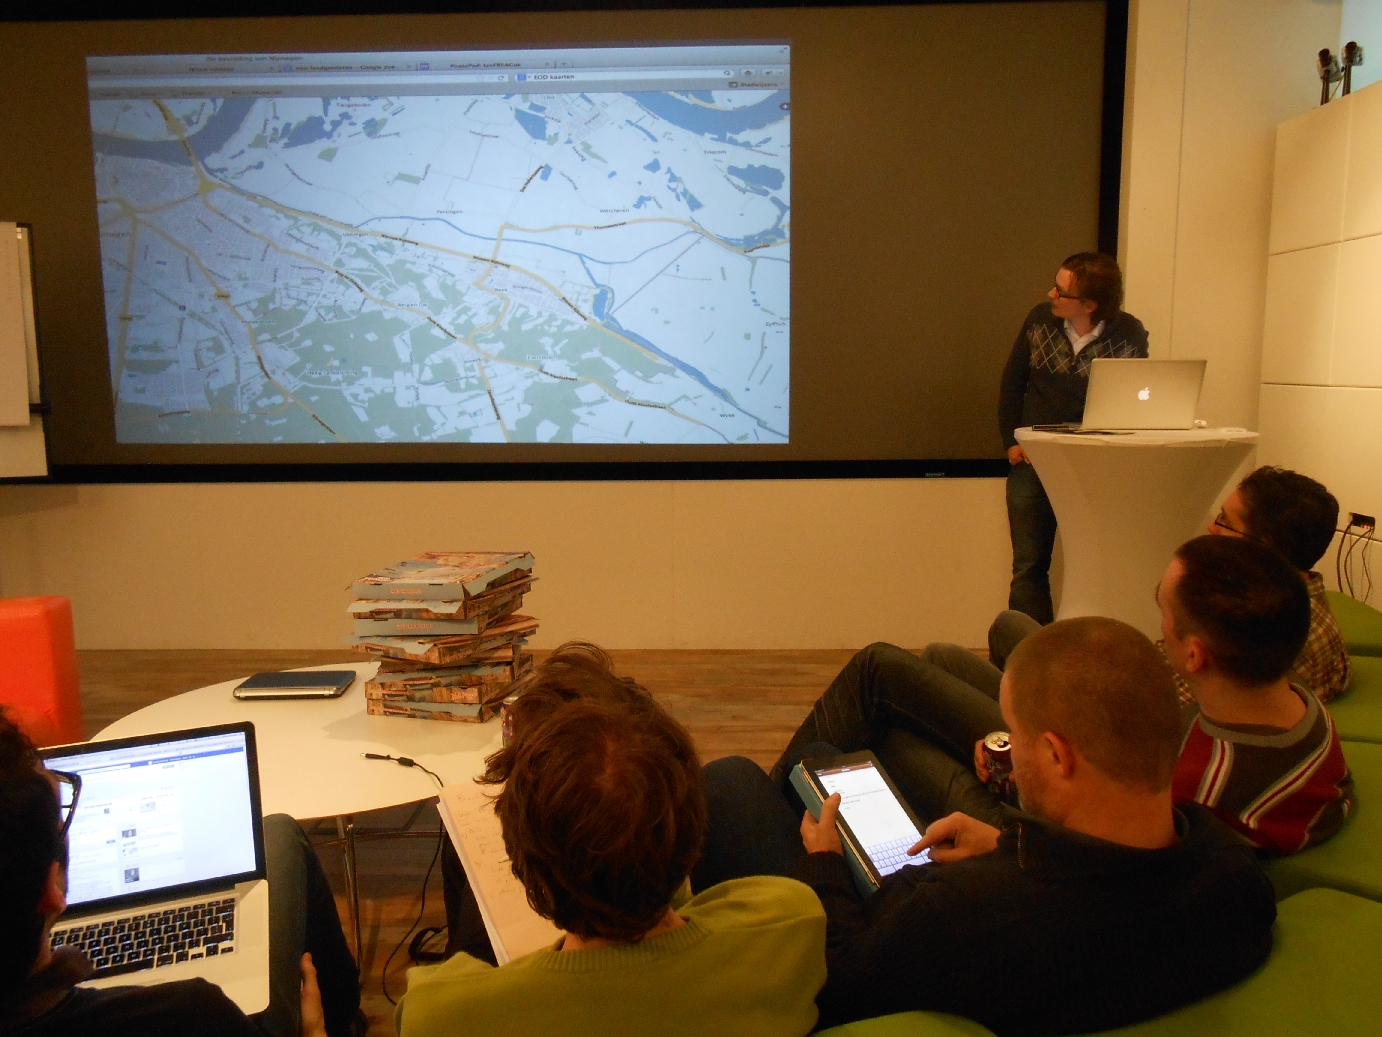 Michiel built a web map application showing the liberation of Nijmegen in 1944. 1940s data and current maps scan be superimposed over eachother therefore showing for example what part of the city was damaged during the liberation. Further additions include 17,19 and 20th Century maps. A demo can be seen at www.numagapp.nl An attempt was made to include Vier en Vijf Mei monument data in this dataset
INCONTEXT DATA VISUALISATION [Willem Melder]
 Willem presented the idea to visualise the VK data using the InContext RDF visualizer for enriched publications. Unfortunately, due to time constraints, Willem did not succeed in getting everything up and running. [screencast]